Agglomerative Clustering From Scratch
This Jupyter Notebook provides a detailed, step-by-step guide on implementing the Agglomerative Clustering algorithm from scratch. It covers the following key areas:
Sample data points
Initialize pairwise distance matrix
Iteratively merge clusters based on single linkage
Visualize the clustering process at each step
[1]:
import random
import numpy as np
from scipy.spatial.distance import pdist, squareform

import seaborn as sns
import matplotlib as mpl
import matplotlib.pyplot as plt

cmap = plt.get_cmap('tab10')
colors = [cmap(i) for i in range(cmap.N)]

mpl.rcParams["font.size"] = 24
mpl.rcParams["lines.linewidth"] = 2

seed = 0
random.seed(seed)
np.random.seed(seed)
n_samples = 10
markersize = 100
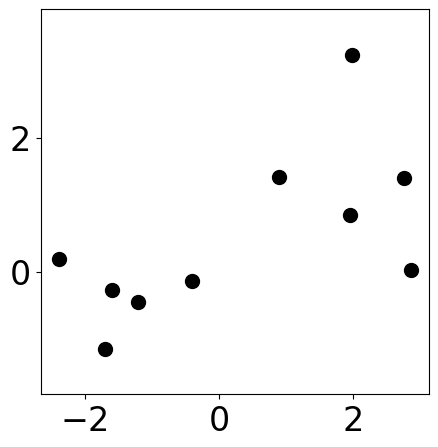
Sample data points
[2]:
m1 = [1, 1]
cov1 = [[1, 0], [0, 1]]
s1 = np.random.multivariate_normal(m1, cov1, 5)

m2 = [-1, -1]
cov2 = [[1, -0.5], [-0.5, 1]]
s2 = np.random.multivariate_normal(m2, cov2, 5)

samples = np.concat([s1, s2])
np.random.shuffle(samples)
[3]:
plt.figure(figsize=(5, 5))
plt.scatter(samples[:, 0], samples[:, 1], s=markersize, color="k")
# plt.axis("off")
plt.xlim([-2, 2])
plt.ylim([-2, 2])
plt.axis("equal")
[3]:
(np.float64(-2.659691942232599),
 np.float64(3.1307603678824707),
 np.float64(-1.3757641112226862),
 np.float64(3.4607340235073694))
Clustering Algorithm
Agglomerative clustering is a hierarchical, bottom-up method. At the beginning, each data point is treated as an individual cluster. In each iteration, the two most similar clusters are merged, and this process continues until a predefined stopping criterion (such as a target number of clusters or a distance threshold) is satisfied.
In this notebook, single linkage criterion is used which determines the distance between two sets based the minimum of the distances between all observations of the two sets. Learn more about different linkage criterions here


[4]:
def agglomerative_clustering(points, n_clusters):
    n_points = points.shape[0]
    cur_clusters = n_points
    clusters = {i: [i] for i in range(n_points)}
    distances = squareform(pdist(points))
    np.fill_diagonal(distances, np.inf)

    merge_list = []
    labels_list = []

    while cur_clusters > n_clusters:
        # single-linkage
        idx = np.argmin(distances)
        i, j = int(idx//n_points), int(idx%n_points)

        merge_list.append((i, j))

        # merge datapoints in cluster i and j
        clusters[i].extend(clusters[j])
        for k in clusters:
            if k != i:
                distances[i, k] = distances[k, i] = min(distances[i, k], distances[j, k])

        # remove cluster j
        clusters.pop(j)
        cur_clusters -= 1
        distances[:, j] = np.inf
        distances[j, :] = np.inf

        # assign labels
        labels = np.zeros(n_points, dtype=int)
        for cluster_id, points in clusters.items():
            for point in points:
                labels[point] = cluster_id
        labels_list.append(labels)

    return labels_list, merge_list
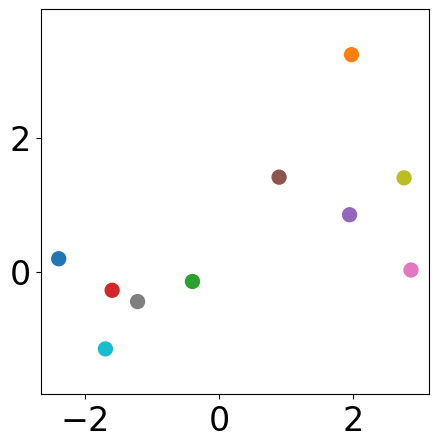
Initialize clusters
[5]:
plt.figure(figsize=(5, 5))
plt.scatter(samples[:, 0], samples[:, 1],
            s=markersize, color=colors)
# plt.axis("off")
plt.axis("equal")
[5]:
(np.float64(-2.659691942232599),
 np.float64(3.1307603678824707),
 np.float64(-1.3757641112226862),
 np.float64(3.4607340235073694))
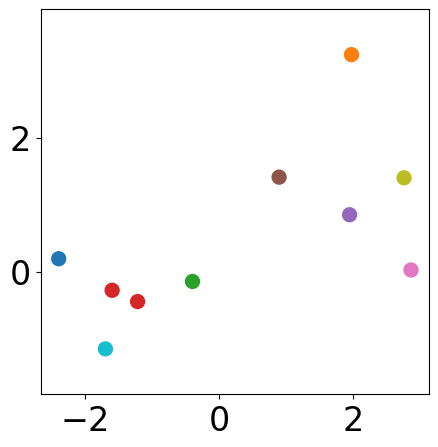
After \(i\) steps
[6]:
k = 2 # divide into 2 clusters
labels_list, merge_list = agglomerative_clustering(samples, k)
[7]:
# modify this index to visualize results step-by-step
step_idx = 0 # after the first step

plt.figure(figsize=(5, 5))
plt.scatter(samples[:, 0], samples[:, 1],
            s=markersize, color=[colors[l] for l in labels_list[step_idx]])
# plt.axis("off")
plt.axis("equal")
[7]:
(np.float64(-2.659691942232599),
 np.float64(3.1307603678824707),
 np.float64(-1.3757641112226862),
 np.float64(3.4607340235073694))
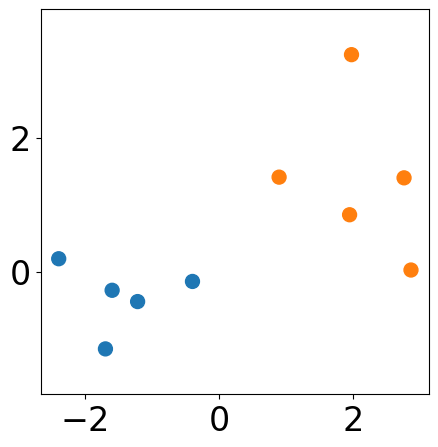
Final results
[8]:
plt.figure(figsize=(5, 5))
plt.scatter(samples[:, 0], samples[:, 1],
            s=markersize, color=[colors[l] for l in labels_list[-1]])
# plt.axis("off")
plt.axis("equal")
[8]:
(np.float64(-2.659691942232599),
 np.float64(3.1307603678824707),
 np.float64(-1.3757641112226862),
 np.float64(3.4607340235073694))