DBSCAN From Scratch
This Jupyter Notebook provides a detailed, step-by-step guide on implementing the DBSCAN (Density-Based Spatial Clustering of Applications with Noise) clustering algorithm from scratch. It covers the following key areas:
Sample data points
Build \(\epsilon\)-neighbourhood
Identify core, border, and noise points
Assign clusters using Depth-First Search (DFS)
Show clustering results


The clustering results depends the choice of \(\epsilon\) and \(minPts\).

[1]:
import random
import numpy as np
from scipy.spatial.distance import pdist, squareform

import matplotlib as mpl
import matplotlib.pyplot as plt

cmap = plt.get_cmap('tab10')
colors = [cmap(i) for i in range(cmap.N)]

mpl.rcParams["font.size"] = 24
mpl.rcParams["lines.linewidth"] = 2

import networkx as nx

seed = 0
random.seed(seed)
np.random.seed(seed)
n_samples = 10
markersize = 100
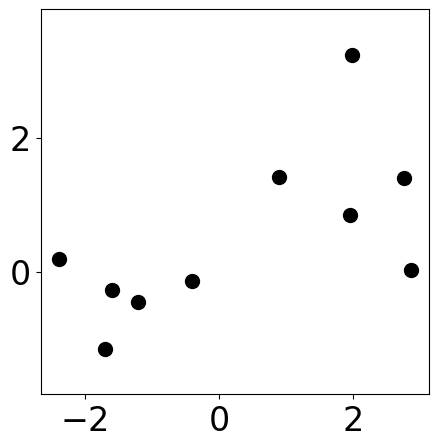
Sample data points
[2]:
m1 = [1, 1]
cov1 = [[1, 0], [0, 1]]
s1 = np.random.multivariate_normal(m1, cov1, 5)

m2 = [-1, -1]
cov2 = [[1, -0.5], [-0.5, 1]]
s2 = np.random.multivariate_normal(m2, cov2, 5)

samples = np.concat([s1, s2])
np.random.shuffle(samples)
[3]:
plt.figure(figsize=(5, 5))
plt.scatter(samples[:, 0], samples[:, 1], s=markersize, color="k")
plt.xlim([-2, 2])
plt.ylim([-2, 2])
plt.axis("equal")
[3]:
(np.float64(-2.659691942232599),
 np.float64(3.1307603678824707),
 np.float64(-1.3757641112226862),
 np.float64(3.4607340235073694))
Build \(\epsilon\)-neighbourhood
[4]:
eps = 2.0
# when min_samples=1,
# it is equivalent to find connected components
min_samples = 3

n_points = samples.shape[0]
distances = squareform(pdist(samples))

# create a networkx graph
G = nx.Graph()

# add nodes with positions
for i in range(n_points):
    G.add_node(i, pos=(samples[i, 0], samples[i, 1]))

# add edges according to distance cutoff
for i in range(n_points):
    for j in range(i + 1, n_points):
        if distances[i, j] < eps:
            G.add_edge(i, j)
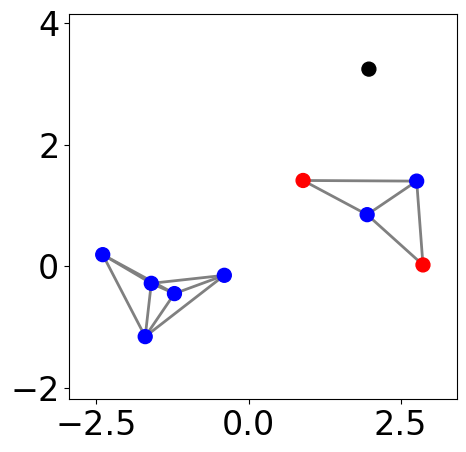
Identify core, border, and noise points
[5]:
# find core points
core_points = []
for i in range(n_points):
    neighbors = list(G.neighbors(i))
    if len(neighbors) >= min_samples:
        core_points.append(i)

def core_border_noise(node):
    if node in core_points:
        return "core"
    else:
        neighbors = list(G.neighbors(node))
        connect_to_core = set(neighbors).intersection(core_points)
        if len(connect_to_core) >= 1:
            return "border"
        else:
            return "noise"

color_dct = {
    "core": "b",
    "border": "r",
    "noise": "k"
}

fig, ax = plt.subplots(figsize=(5, 5))
pos = nx.get_node_attributes(G, "pos")
nx.draw_networkx_nodes(G, pos,
        node_size=markersize, \
        node_color=[color_dct[core_border_noise(node)] for node in G], ax=ax)
nx.draw_networkx_edges(G, pos, edgelist=G.edges,
                       edge_color="gray", width=2)

ax.tick_params(left=True, bottom=True, labelleft=True, labelbottom=True)
plt.xlim([-2, 2])
plt.ylim([-2, 2])
plt.axis("equal")
plt.show()
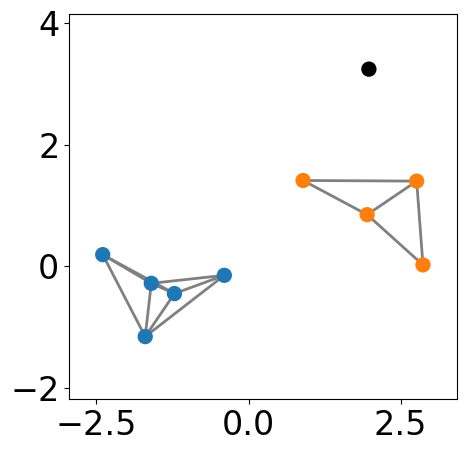
Assign clusters using Depth-First Search (DFS)
[6]:
labels = np.full(n_points, -1)
cluster_id = 0

for core_point in core_points:
    if labels[core_point] == -1:
        stack = [core_point]
        # dfs-like search
        while stack:
            point = stack.pop()
            if labels[point] == -1:
                labels[point] = cluster_id
                neighbors = list(G.neighbors(point))
                for neighbor in neighbors:
                    if neighbor in core_points and labels[neighbor] == -1:
                        stack.append(neighbor)
                    else:
                        # truncate search for non-core point
                        labels[neighbor] = cluster_id
        cluster_id += 1
[7]:
fig, ax = plt.subplots(figsize=(5, 5))
pos = nx.get_node_attributes(G, "pos")
nx.draw_networkx_nodes(G, pos,
        node_size=markersize, node_color=[colors[l] if l>=0 else "k" for l in labels], ax=ax)
nx.draw_networkx_edges(G, pos, edgelist=G.edges,
                       edge_color="gray", width=2)

ax.tick_params(left=True, bottom=True, labelleft=True, labelbottom=True)
plt.xlim([-2, 2])
plt.ylim([-2, 2])
plt.axis("equal")
plt.show()